
The best AI investment research tools in 2026 are not the ones that produce the longest market summaries. They are the ones that help you check a claim before you act on it. A good tool shows its source, separates a fact from a forecast, and makes it easy to see what changed since the last earnings call. A weak tool does the opposite. It gives a confident answer, hides the data behind it, and leaves you to discover the error after you have already sized a position.
That distinction matters more in investing than in most kinds of research. A wrong answer about a recipe costs a meal. A wrong answer about earnings, debt, or cash flow can cost real money. So this guide applies a strict test to every tool below. Can you trace its main claims back to a filing, a price series, or an on chain record? Does it tell you when its data was last updated? Does it warn you when a number is an estimate rather than a reported figure? Tools that pass that test earn a place here. Tools that only sound informed do not.
The 11 best AI investment research tools at a glance
| Tool | Main job | Best for |
| TradingView | Stock screening and charting | Chart based screening |
| Finviz | Fast stock screening | Quick idea lists |
| Stock Rover | Deep stock screening | Fundamental screeners |
| AlphaSense | Earnings and filing search | Professional filing research |
| Koyfin | Market data and filings | All in one market research |
| FinChat.io | Company and earnings data | Clean financial dashboards |
| Portfolio Visualizer | Portfolio backtesting | Allocation testing |
| Morningstar Investor | Portfolio and fund research | Fund and stock ratings |
| LunarCrush | Crypto and social sentiment | Social signal tracking |
| Santiment | Crypto on chain and social data | On chain behaviour |
| Glassnode | Bitcoin and crypto on chain data | Long term network trends |

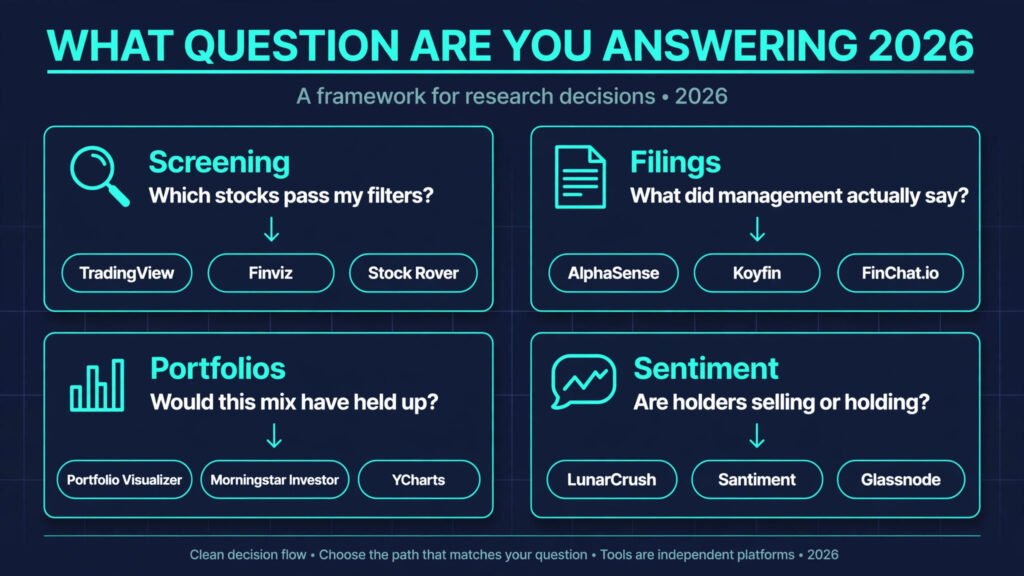
Pick by the question you are answering
| Your question | Start with | Why |
| Which stocks pass my filters? | Stock Rover | Deepest fundamental filters in this list |
| What is the chart telling me? | TradingView | Strongest charting and screening in one place |
| What did management actually say? | AlphaSense | Searchable calls and filings |
| How does this company really earn? | FinChat.io | Clear statements and segment views |
| Would this mix have held up? | Portfolio Visualizer | Honest backtests with limits shown |
| Is this fund worth its fee? | Morningstar Investor | Ratings plus fee and holding detail |
| Is the crowd euphoric or fearful? | LunarCrush | Social volume and sentiment in one view |
| Are holders selling or holding? | Glassnode | Long term holder and exchange flow data |
Stock screening tools
Screening is where most research starts, and where most mistakes start too. A screen is only as good as its data, its filters, and your willingness to read what it leaves out. The three tools below cover speed, depth, and charting. None of them should be your only filter.
1. TradingView

TradingView is a charting platform with a strong stock screener built in. You can filter by price, volume, market cap, technical indicators, and fundamental ratios, then move straight to a chart for the same stock without changing tools. That short loop from screen to chart is its main strength. It suits investors who want to see whether a fundamental idea also looks workable on a chart.
Pricing: Free plan available. Paid plans are billed monthly or yearly. Check checkout for current prices, since plan prices and limits change.
Best for: Investors who screen and chart in the same session.
Watch out for: Social ideas and custom indicators can look convincing without any tested track record. Verify any signal on your own data before you use it.
Try it at: https://www.tradingview.com/
2. Finviz
Finviz is built for speed. Its screener loads fast, its filters are easy to change, and its heat maps give a quick view of what a sector or index did in a day. For a first pass through hundreds of stocks, few tools waste less of your time. You can move from a broad filter to a short list in minutes, then take the survivors to a deeper tool for full research.
The trade off is depth. Finviz is not a filing reader, and it is not a portfolio backtester. It answers the question of what passes a filter. It does not answer whether the business behind the ticker is sound. Use it to build a list, then do the harder work elsewhere.
Pricing: Free version available. Elite access is a paid upgrade. Check checkout for current prices.
Best for: Fast first pass screening and daily market maps.
Watch out for: A clean screen result can hide weak cash flow, rising debt, or one off gains. Always check the financial statements before you act.
Try it at: https://finviz.com/
3. Stock Rover
Stock Rover is the depth option in this group. It offers hundreds of screening criteria, detailed financial history, analyst estimates, and portfolio tracking in one place. If your process depends on precise filters, such as return on invested capital over five years, free cash flow growth, and debt levels at the same time, Stock Rover handles that combination better than a fast screener will.
Pricing: Free plan with limited features. Paid plans are billed monthly or yearly. Check checkout for current prices.
Best for: Fundamental investors who need precise, multi factor screens.
Watch out for: Historical data can flatter a strategy that would not have been obvious at the time. Check for survivorship bias and restated figures in any long backtest.
Try it at: https://www.stockrover.com/
Earnings and filing research tools
Earnings calls and filings are the primary sources that matter most, and they are also the hardest to read at scale. The tools below help you search them, compare periods, and find the sentence that changes a thesis. They do not replace reading the filing when a decision turns on one number.
4. AlphaSense

AlphaSense searches earnings calls, filings, press releases, and research documents from one search box. You can search for a phrase across many companies, compare how management described the same problem in different quarters, and jump to the exact passage instead of reading a whole transcript. For professional research, that search power is the point. It turns a vague memory of something said on a call into a citable quote in minutes.
Pricing: Priced for teams and professional users. Check checkout for current prices and trial terms.
Best for: Investors and analysts who search calls and filings every week.
Watch out for: Search results still need context. A quote from one quarter can mislead if the question, the segment, or the accounting basis has changed.
Try it at: https://www.alpha-sense.com/
5. Koyfin
Koyfin combines market data, financial statements, estimates, and news in a clean dashboard. You can build watchlists, compare companies side by side, and move from a price chart to revenue, margins, and balance sheet detail without opening five tabs. That matters because most research errors come from context switching. When each number lives in a different tool, it is easy to compare a trailing figure with a forward estimate by mistake.
Pricing: Free plan available. Paid plans are billed monthly or yearly. Check checkout for current prices.
Best for: Investors who want market data, statements, and estimates in one dashboard.
Watch out for: Estimates vary by provider. When two sources disagree, check which analysts are included and when the estimate was last updated.
Try it at: https://www.koyfin.com/
6. FinChat.io
FinChat.io presents company financials, segments, KPIs, and earnings data in a clear, readable format. Its strength is not a single exotic feature. It is the removal of friction. You can see revenue by segment, check gross margin over time, and compare a company with peers without wrestling with a dense filing layout. For investors who learn by looking at trends, that clarity is valuable.
Pricing: Free plan available. Paid plans are billed monthly or yearly. Check checkout for current prices.
Best for: Investors who want clean financial dashboards and segment detail.
Watch out for: Segment definitions change over time. A sudden jump in one segment may reflect a reclassification, not growth.
Try it at: https://finchat.io/
Portfolio analysis tools
A single stock can look attractive while a portfolio built from similar stocks carries hidden concentration risk. The tools below help you test allocation, compare funds, and see how a mix behaved in past stress periods. Past behaviour is not a promise, but it is a better starting point than a feeling about diversification.
7. Portfolio Visualizer
Portfolio Visualizer is a backtesting and allocation tool. You can test a mix of stocks, funds, and asset classes, compare it with a benchmark, and see returns, volatility, drawdowns, and rolling periods. Its value is in showing trade offs clearly. A portfolio that earned more may also have fallen further in a crisis, and a lower return portfolio may have been far easier to hold.
The limit is the same as with any backtest. The past period you choose shapes the result. A test that starts after a crash will flatter risk assets. A test that ends at a market peak will flatter almost everything. Run several periods, include a stress period, and treat the result as a range of outcomes, not as a forecast.
Pricing: Free plan with limited features. Paid plans are billed monthly or yearly. Check checkout for current prices.
Best for: Investors testing allocation, rebalancing, and drawdown behaviour.
Watch out for: Optimised portfolios often fail out of sample. If a mix only works with exact weights, it is probably fitted to the past, not built for the future.
Try it at: https://www.portfoliovisualizer.com/
8. Morningstar Investor
Morningstar Investor gives research, ratings, and portfolio tools for stocks, funds, and exchange traded funds. Its analyst ratings, fee data, and holding breakdowns help answer a different question from a backtester. Instead of asking how a mix performed, you can ask whether a fund is worth its fee, how concentrated its holdings are, and how its style has drifted over time.
Pricing: Paid subscription, usually billed monthly or yearly. Check checkout for current prices and trial terms.
Best for: Fund investors who want ratings, fees, and holding detail in one place.
Watch out for: A star rating reflects past risk adjusted performance, not future skill. A highly rated fund can still be wrong for your time horizon or tax situation.
Try it at: https://www.morningstar.com/
Crypto and market sentiment tools
Crypto markets move on a mix of on chain flows, exchange activity, and social attention. The tools below measure those forces directly instead of relying on price alone. They are useful, but they need more care than stock tools, because sentiment can reverse fast and on chain labels are estimates, not certainties.
9. LunarCrush
LunarCrush tracks social volume, sentiment, and influencer activity across crypto assets. It shows which coins are gaining attention, whether that attention is positive or negative, and how social activity compares with price movement. For traders and researchers who watch narrative cycles, that view is hard to get from a price chart alone.
Pricing: Free plan available. Paid plans add deeper data and alerts. Check checkout for current prices.
Best for: Crypto researchers tracking social attention and sentiment shifts.
Watch out for: Bot activity and paid promotion can inflate social volume. A rising social score is not the same as rising adoption.
Try it at: https://lunarcrush.com/
10. Santiment
Santiment combines on chain data, social data, and development activity for crypto assets. You can see active addresses, exchange flows, whale transactions, and developer commits beside price. That combination matters because each signal alone is weak. Rising active addresses plus rising development activity tells a stronger story than either signal on its own.
Pricing: Free plan with limited metrics. Paid plans are billed monthly or yearly. Check checkout for current prices.
Best for: Crypto researchers who want on chain, social, and development data together.
Watch out for: On chain labels for exchanges and whales are best estimates. Treat large holder data as directional, not exact.
Try it at: https://santiment.net/
11. Glassnode

Glassnode focuses on Bitcoin and wider crypto on chain data, with long term holder behaviour, exchange balances, realised price, and network activity. Its strength is patience. Where social tools react to the last hour, Glassnode helps you see whether long term holders are accumulating, whether coins are moving to exchanges, and whether the network is being used more or less than in past cycles.
Pricing: Free tier with basic metrics. Paid plans add full studio access and deeper history. Check checkout for current prices.
Best for: Long term crypto investors studying holder behaviour and network trends.
Watch out for: Realised price and holder metrics depend on definitions and labelling. Compare the same metric over time rather than treating one reading as a precise fair value.
Try it at: https://glassnode.com/
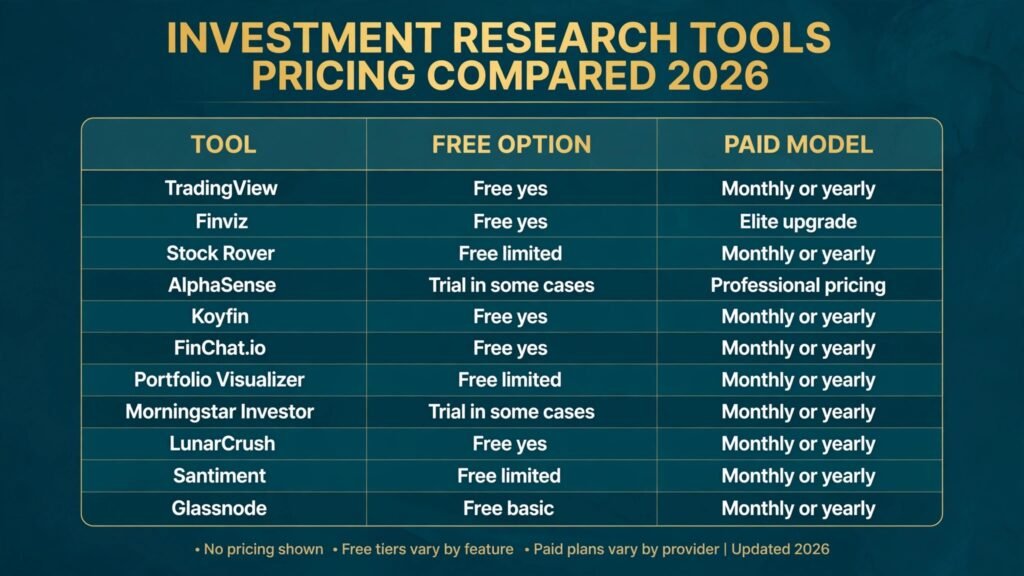
Pricing compared
| Tool | Free option | Paid model |
| TradingView | Yes | Monthly or yearly, check checkout |
| Finviz | Yes | Elite upgrade, check checkout |
| Stock Rover | Yes, limited | Monthly or yearly, check checkout |
| AlphaSense | Trial in some cases | Professional pricing, check checkout |
| Koyfin | Yes | Monthly or yearly, check checkout |
| FinChat.io | Yes | Monthly or yearly, check checkout |
| Portfolio Visualizer | Yes, limited | Monthly or yearly, check checkout |
| Morningstar Investor | Trial in some cases | Monthly or yearly, check checkout |
| LunarCrush | Yes | Monthly or yearly, check checkout |
| Santiment | Yes, limited | Monthly or yearly, check checkout |
| Glassnode | Yes, basic | Monthly or yearly, check checkout |
Prices in this section are deliberately general. Research tools change plan limits and prices often, and a precise figure copied today can be wrong by the time you read it. The honest rule is simple. Start free where a free tier exists, measure whether the paid tier saves you time or prevents a mistake, and only then pay. A tool that costs little but is rarely opened is more expensive than a tool that costs more and is used every week.
How to Choose
Start with your decision, not with a feature list. If you mainly pick individual stocks, a screener plus a filing tool will cover most of your work. If you mainly choose funds, a fund research tool plus a backtester matters more. If you trade crypto, on chain and sentiment tools matter, but they still need a risk rule to be useful.
Next, test data freshness and sourcing. Open a company you know well. Check whether the latest quarter is present, whether the numbers match the filing, and whether the tool marks estimates clearly. If a tool is slow to update earnings, or if it blends reported and estimated figures without labels, it will mislead you at exactly the moment when accuracy matters most.
Then test the workflow on a real decision. Take one stock or fund you are considering, run it through your short list, and write down what each tool changed about your view. If a tool only confirmed what you already believed, it added little. If a tool surfaced a risk you had missed, such as rising debt, customer concentration, or a fee you had overlooked, it earned its place.
Finally, set a budget rule before you subscribe. A useful rule is that a paid tool must either save at least two hours a month or prevent one class of mistake you have actually made before. If it does neither, the free tier or a cheaper alternative is the right choice. Research tools should reduce uncertainty, not create a new monthly habit of collecting dashboards.
Mistakes to avoid
The first mistake is trusting an AI summary without reading the source. Summaries compress, and compression drops qualifiers. A summary that says revenue grew may omit that growth came from an acquisition, a price rise, or a change in reporting segments. When a claim affects your decision, open the filing and read the passage in full.
The second mistake is screening for performance instead of quality. A screen for the highest past returns will return stocks that already rose, often for reasons that will not repeat. A better screen starts with business quality, cash generation, and balance sheet strength, then checks valuation and momentum as secondary filters.
The third mistake is treating sentiment as demand. Social volume, search interest, and media coverage measure attention, not buying power or lasting use. Attention can drive a short move and still leave a project with no revenue, no users, and no path to either. Pair every sentiment signal with on chain, financial, or product evidence.
The fourth mistake is overfitting a backtest. A portfolio that looks perfect on one historical period may depend on a single asset, a single crisis, or weights that no investor would have held at the time. Test across periods, include costs and taxes where possible, and prefer a simple mix you can hold through a drawdown over a complex mix you will abandon at the first fall.
The fifth mistake is paying for many tools and using none of them well. A large stack feels productive, but research quality comes from depth, not breadth. Choose two or three tools that cover your main decisions, learn their limits, and use them consistently. Add a new tool only when a specific question keeps going unanswered.
The sixth mistake is ignoring position size. Even good research cannot turn a concentrated bet into a safe one. A tool can help you choose what to buy, but it cannot decide how much risk your portfolio can carry. Set position limits, review concentration by sector and factor, and revisit those limits when a holding grows faster than the rest of the portfolio.
Frequently asked questions
Are AI investment research tools safe to rely on for buy and sell decisions?
They are safe as research aids, not as decision makers. Use them to find data, compare companies, and test ideas. Verify material numbers in filings or primary market data, and keep the final decision with your own rules for valuation, risk, and time horizon. No tool in this guide removes market risk.
Do I need a paid tool, or is a free tier enough?
Many investors can start free. TradingView, Finviz, Koyfin, FinChat.io, Portfolio Visualizer, LunarCrush, and Glassnode all offer free access that covers basic research. Pay when you hit a real limit, such as missing history, too few watchlists, or no filing search, and when the paid feature saves time every week.
How do I check whether an AI summary is accurate?
Find the source passage. A good tool links to the filing, call transcript, or data series behind a claim. Read that passage, check the date and the reporting period, and confirm whether the figure is reported, estimated, or adjusted. If a tool gives no source, treat the claim as unproven until you find one yourself.
Are crypto sentiment tools reliable?
They are useful for measuring attention and behaviour, not for predicting price with certainty. Social data can be gamed, and on chain labels are estimates. Use sentiment and on chain tools to understand regime and risk, combine them with price and position rules, and avoid sizing a trade on a single sentiment spike.
What is the best tool for a beginner investor?
Start with Koyfin or FinChat.io for company research, TradingView or Finviz for screening, and Portfolio Visualizer if you want to test a simple allocation. That combination covers the main questions without a large bill. Add AlphaSense or Morningstar Investor later, when filing research or fund choice becomes a regular part of your process.
Can these tools help with taxes or financial advice?
They can help you understand holdings, fees, and performance, but they are not tax or financial advice. Tax rules depend on your country, account type, and holding period. For a large decision, a complex tax situation, or a retirement plan, speak to a qualified adviser who can see your full financial picture.
Conclusion
The best investment research tools share one habit. They make verification easier, not harder. They show sources, mark estimates, update promptly, and let you compare a claim with the underlying data. The weakest tools do the opposite. They hide uncertainty behind fluent language and leave you to find the error on your own.
Build a small stack around your real decisions. Screen with care, read filings when a number matters, test allocation across more than one period, and treat sentiment as context rather than proof. Review costs every quarter, and drop any tool that no longer changes a decision. Done that way, AI research tools do not replace judgment. They give judgment better material to work with, and that is exactly what a careful investor should want from them.