
A new investor who spends 45 minutes every evening reading random stock tips, checking three apps and second guessing yesterday’s buy loses more than five hours a week to noise, and the best ai stock analysis tools for beginner investors exist to turn those scattered minutes into one clear routine. Morningstar Investor leads this guide because its analyst fair value estimates give a beginner a grounded answer to the only question that matters at the start, which is whether a stock looks cheap or expensive against its own earning power, and it costs 249 dollars a year or 34.95 dollars a month.
Seeking Alpha Premium follows for investors who want many viewpoints beside a computer scored rating, since it pairs contributor analysis with quant ratings on about 5,600 stocks, and it costs 299 dollars a year plus taxes. TradingView sits close behind for chart first learners, because its Essential plan costs 14.95 dollars a month and its charts are the clearest in this guide. The remaining five tools cover value screening, dividend research, analyst consensus and portfolio checks, and each one earns its place by answering a specific beginner question better than the generalists do.
A beginner does not need more data. A beginner needs a smaller set of numbers that mean something, checked in the same order every week. The tools in this guide were judged on that test, because a screener with two hundred data points will paralyse a new investor, while a screen with five honest signals will teach them how to think.
What a Beginner Actually Needs From a Screener
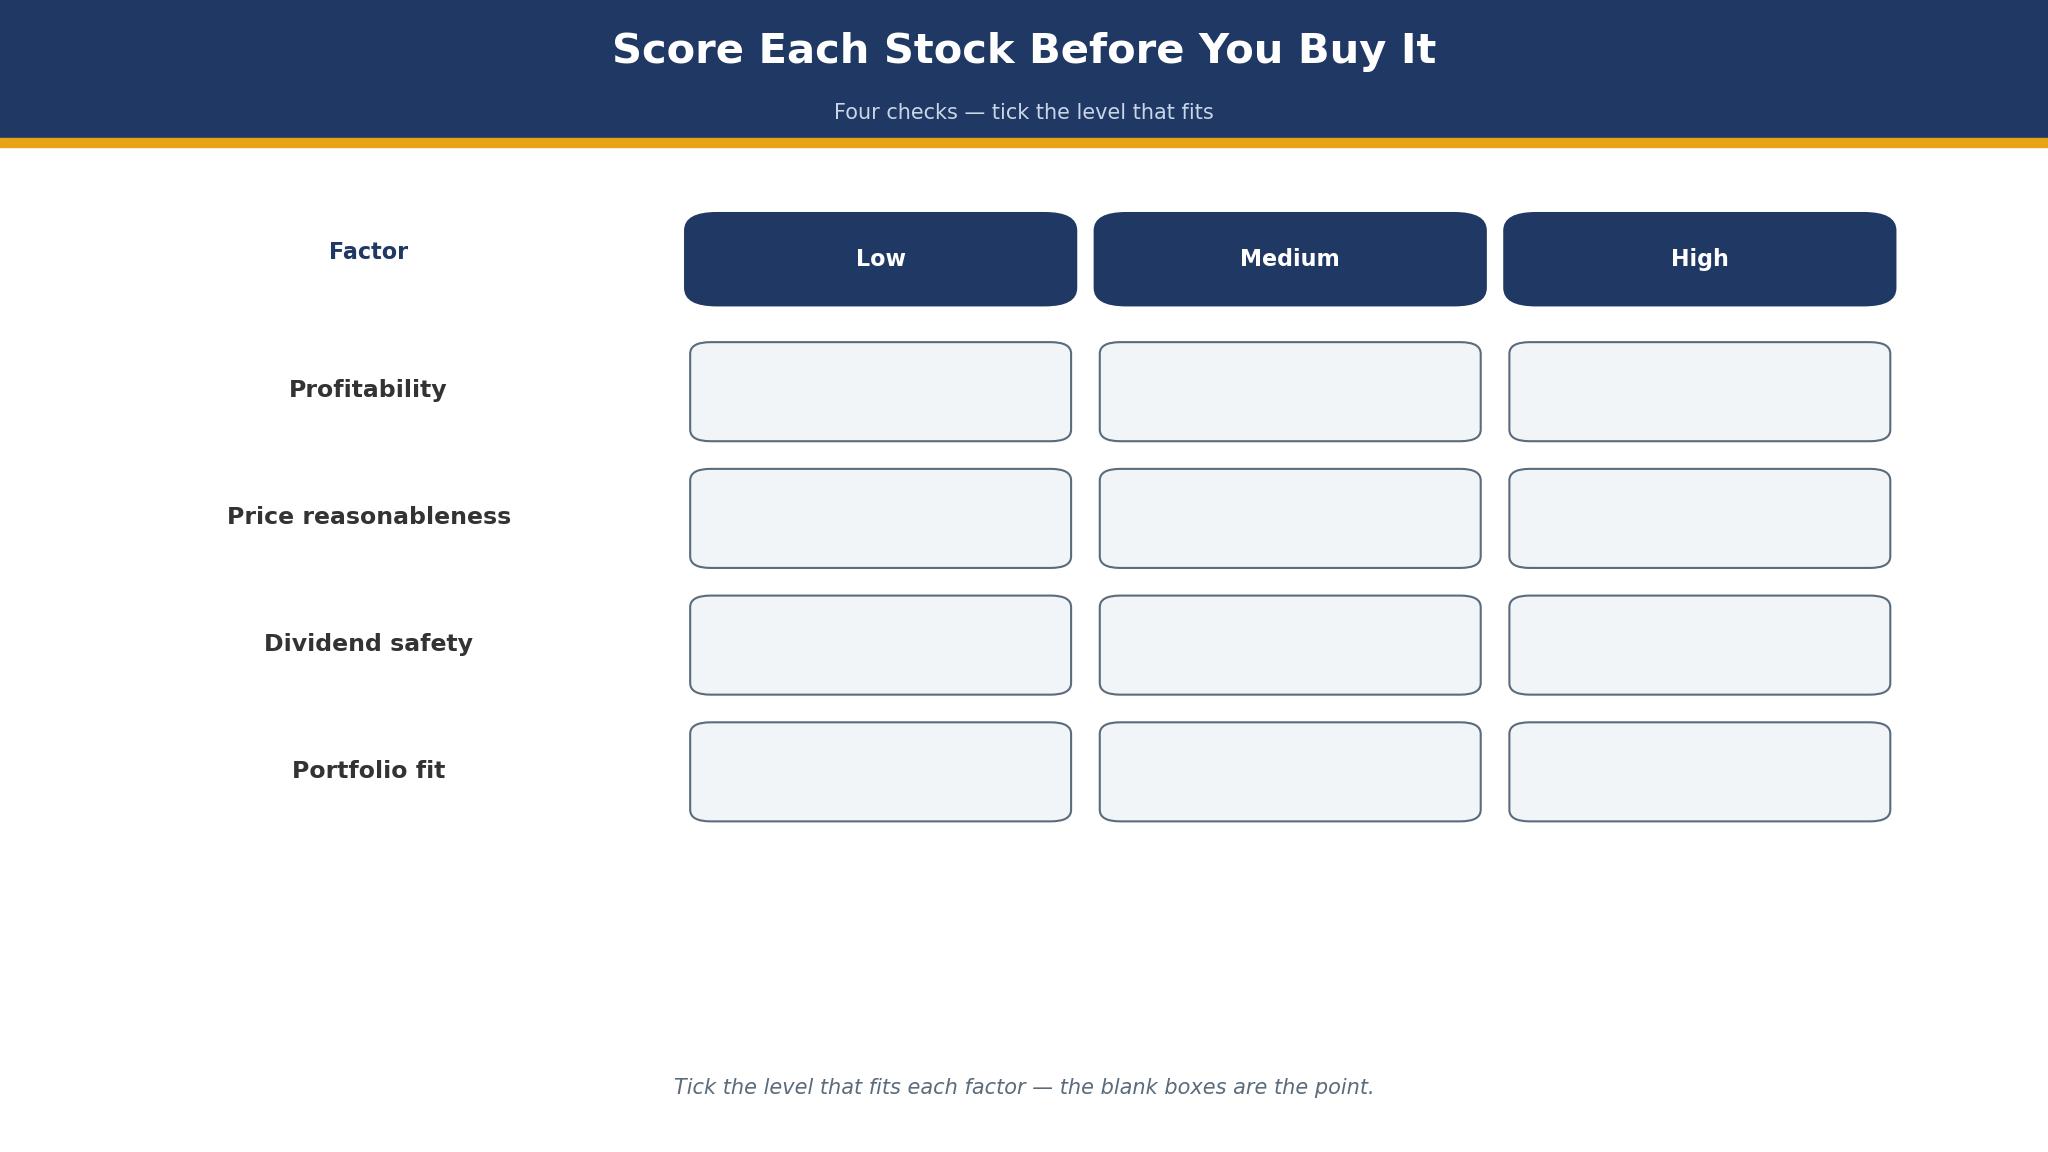
A screener should answer three questions in under a minute. Is the company profitable, is the price reasonable against its earnings, and is the dividend safe when there is one. A beginner who can answer those three questions about any stock has enough to decide whether to read further, and a tool that buries those answers under fifty columns will slow that decision down instead of speeding it up.
The second need is a rating that explains itself. A letter grade or a star rating is useful only when the tool shows the numbers behind it, because a beginner who cannot see why a stock scores well cannot learn from the score. Morningstar shows the fair value range and the moat rating beside the stars, Seeking Alpha shows the five factor grades behind the quant rating, and Stock Rover shows the metrics behind every screen.
The third need is a portfolio view. A beginner who holds eight stocks needs to see the overlap, the fees and the sector weights in one place, because five technology stocks bought one at a time look diversified until the portfolio view shows the truth. The best ai stock analysis tools for beginner investors in this guide all carry some form of portfolio check, and the detail sections below call out which ones do it well.
The Cost of Learning by Trial and Error
Trial and error is the most expensive teacher in investing. A beginner who buys on a tip, sells on a headline and repeats the cycle three times can lose more in a month than a year of research tools would cost. The tools in this guide cost between 15 dollars a month and 299 dollars a year, and one avoided mistake pays for the cheapest of them many times over.
The cost is not only money. Every impulsive trade teaches the wrong lesson, because a lucky win on a bad process convinces the beginner that the process works, and the correction arrives later at a higher price. A research routine built on a screener, a fair value check and a written reason for buying will not prevent losses, but it will make the losses teachable.
Time is the third cost. A beginner who spends five hours a week on random tips and zero hours on a routine will still be a beginner in a year. A beginner who spends two hours a week on a fixed routine, screening, reading one analyst report and updating a watchlist, will have a method.
Why a Rating Is Not a Recommendation
A rating is a summary of numbers, and a recommendation is a judgment about a person, and the two are not the same. A stock can carry a strong quant rating and still be wrong for a beginner who needs income, just as a stock can carry a weak rating and still suit an investor with a ten year horizon.
The honest way to use a rating is as a filter, not as a verdict. A beginner who screens for profitable companies with reasonable prices, then reads one analyst report and one bearish view before buying, will make fewer mistakes than a beginner who buys the top rated stock on the list. The rating narrows the field, and the reading decides the buy.
Analyst consensus carries the same warning. A stock that twenty analysts love can still fall, and a stock that analysts ignore can still compound, because consensus reflects what is already known. TipRanks and Zacks both publish consensus views, and the detail sections below explain how to read them without treating them as a promise.
The 8 Tools at a Glance
| Tool | Main job | Best for | Starting price |
|---|---|---|---|
| Morningstar Investor | Analyst fair value and fund research | Long-term value beginners | 249 dollars a year |
| Seeking Alpha Premium | Quant ratings plus contributor analysis | Daily stock researchers | 299 dollars a year |
| TradingView | Charts and community ideas | Chart first learners | 14.95 dollars a month |
| Zacks Premium | Ranked stock lists and research | Beginners who want a ranked list | 199 dollars a year, reported |
| Stock Rover | Deep screening and portfolio analytics | Number driven beginners | 29 dollars a month |
| TipRanks | Analyst consensus and smart scores | Checking what analysts think | About 30 dollars a month, reported |
| Simply Wall St | Visual company snapshots | Visual learners | About 199 dollars a year, reported |
| Yahoo Finance Premium | Research, ideas and portfolio tools | Beginners already using Yahoo Finance | 34.99 dollars a month |
Best Pick by Job
| Job type | First pick | Second tool | Why this pair works |
|---|---|---|---|
| Learning value investing | Morningstar Investor | Simply Wall St | Morningstar gives fair value depth and Simply Wall St makes it visual |
| Daily stock research | Seeking Alpha Premium | TipRanks | Seeking Alpha gives many views and TipRanks checks analyst consensus |
| Chart first learning | TradingView | Stock Rover | TradingView teaches price action and Stock Rover adds fundamentals |
| Dividend income focus | Stock Rover | Morningstar Investor | Stock Rover screens dividends precisely and Morningstar checks safety |
| Checking one stock fast | Yahoo Finance Premium | Seeking Alpha Premium | Yahoo Finance gives a quick snapshot and Seeking Alpha adds depth |
How a beginner likes to learn points at the tool. One learning value investing needs fair value estimates and patience, while one trading on charts needs clean price data and indicators, and a service that covers both halves halfway still fails the beginner on the routine it actually follows. Let the learning style choose the first tool, and keep the other one ready for the questions the first cannot answer.
Size the subscription to the portfolio behind it. A beginner with 5,000 dollars invested can justify 249 dollars a year for Morningstar Investor, because the cost is five percent of the portfolio and one avoided mistake pays for it. A beginner with 500 dollars invested cannot, and should start free on TradingView or Yahoo Finance, then upgrade when the portfolio grows. The best ai stock analysis tools for beginner investors are judged here on the value of the routine they build, not on the length of the feature list.
How to Judge the best ai stock analysis tools for beginner investors
Start with the one stock test, because that is where a research tool either earns its fee or wastes it. Pick a company you already know, open its page, and see whether the tool tells you in one minute if it is profitable, whether the price looks reasonable, and what the main risk is. A tool that answers all three plainly will teach you something, while one that shows fifty numbers without a summary will leave you guessing. Check whether the rating explains itself, since a score without reasons cannot be learned from.
Next, test the screener on a real question. Screen for profitable companies with a dividend yield above two percent and a price below their fair value estimate, and count how many results you get and whether you can understand why each one passed. Look for a screener that lets you save the screen and rerun it weekly, because a routine needs a repeatable step. The best ai stock analysis tools for beginner investors let you build that screen in minutes and explain every filter in plain words.
Then check the portfolio view with your real holdings, even when there are only three of them. Open the portfolio tool, enter the tickers, and look for overlap, sector weight and fees. A tool that shows the portfolio clearly will change how you buy the next stock, while one that hides the view behind a higher tier will leave the beginner flying blind. Look for a free trial, since a week of real use will tell you more than any review.
The 8 Tools in Detail
Fair value depth sets the order below, so the tool that best answers whether a stock is cheap leads the list.
1. Morningstar Investor
Morningstar Investor is the strongest choice for a long-term beginner, and its analyst fair value estimates are the reason. Every covered stock and fund carries a star rating based on price against value, a moat rating for competitive advantage, and a written analyst report, so a beginner can read why a stock looks cheap instead of trusting a number alone. It costs 249 dollars a year, or 34.95 dollars a month, with a seven day free trial for new users and a first year promotion often reported near 199 dollars.
The drawback is the price and the pace. At 249 dollars a year it is the most expensive research service a beginner is likely to consider, and the monthly rate nearly doubles the annual cost, so paying yearly is the only sensible choice. The research suits patient investors, and a beginner who wants daily ideas or fast trading signals will find the pace slow. The coverage leans toward large companies and funds, so small stocks get thinner reports.
Morningstar Investor suits beginners learning value investing with a long horizon. It fits an investor building a retirement portfolio, a beginner who wants to understand why a stock is cheap, and anyone who values fund and ETF research beside stock research. The fair value estimate is the feature that matters, because a beginner who knows the value range will not panic at the first price drop.
Open the page of a stock you own, read the analyst report, and write down the fair value range and the moat rating. If those two numbers change how you think about holding it, Morningstar Investor will carry your research routine.
2. Seeking Alpha Premium
Seeking Alpha Premium is the deepest idea library for a daily researcher, and its combination of quant ratings and contributor analysis is the reason. Every stock carries a quant rating built from five factor grades, beside analysis from thousands of outside contributors, so a beginner can read several views on the same company in one place. It costs 299 dollars a year plus taxes, with a first month introductory offer commonly reported at 4.95 dollars, and Alpha Picks is a separate product at 499 dollars a year.
The drawback is the volume and the mixed quality. Contributor analysis ranges from careful research to thin opinion, and a beginner must learn to tell the two apart, which takes time. The annual billing is the only option, so the full 299 dollars is due up front, and the site pushes the separate Alpha Picks product hard.
Seeking Alpha Premium suits investors who read research daily and want many viewpoints. It fits a beginner who enjoys reading about stocks, an investor who wants quant screening across about 5,600 stocks, and anyone who learns by comparing a bullish case with a bearish one. The quant rating is the feature that matters, because a computer scored grade beside human opinion gives the beginner two independent checks.
Pick one stock, read the quant grades and two contributor articles with opposite views, and note where they disagree. If the disagreement teaches you something about the business, Seeking Alpha Premium will carry your daily research.
3. TradingView
TradingView is the clearest charting tool in this guide, and its charts are the reason. The Essential plan costs 14.95 dollars a month, with Pro and Premium above it, and the free plan already covers basic charts with community ideas. A beginner can draw trend lines, test indicators and read published ideas from other traders, all in a browser, without installing anything.
The drawback is the learning curve and the noise. The indicator library is enormous, and a beginner who adds twelve indicators to one chart will learn nothing except confusion. The community ideas range from careful analysis to hype, and the social feed can pull a beginner toward short term trading. The fundamentals are thinner than Morningstar or Stock Rover, so a beginner who relies on TradingView alone will miss the earnings picture.
TradingView suits chart first learners who want to understand price movement. It fits a beginner learning technical analysis, an investor who wants to watch a watchlist visually, and anyone who learns by drawing on a chart rather than reading a table. The charting is the feature that matters, because a beginner who can see support and resistance will time entries with more patience.
Open a chart of a stock you follow, add one moving average and one volume indicator, and watch it for a week. If the chart starts to make sense without adding more indicators, TradingView will carry the visual half of your research.
4. Zacks Premium
Zacks Premium is the ranked list tool in this guide, and its Zacks Rank is the reason. The Rank scores stocks from one to five based on earnings estimate revisions, so a beginner gets a simple ordered list to start from, with research reports and screeners behind it. The list price is reported at 199 dollars a year, with a first year offer for new members reported at 99 dollars, and a 30 day membership fee refund period instead of a free trial.
The drawback is the narrow signal and the price opacity. The Rank leans heavily on earnings revisions, so a great company with flat estimates can rank poorly, and a beginner who buys only rank one stocks will miss the rest of the picture. The pricing page shows different offers to different visitors, so the figure quoted here is reported rather than a fixed vendor list price, and the renewal price can surprise. The research depth is thinner than Morningstar on funds and ETFs.
Zacks Premium suits beginners who want a ranked starting list and a clear first step. It fits an investor who likes a simple score, a beginner who wants earnings focused research, and anyone who prefers a shortlist to a blank screener. The Rank is the feature that matters, because a beginner who starts from a ranked list will actually start, instead of staring at an empty screen.
Run the Rank screen for one sector, pick the top three names, and read the research note on each. If the notes explain the rank in words you understand, Zacks Premium will carry the first step of your routine.
5. Stock Rover
Stock Rover is the deepest screener in this guide, and its metrics library is the reason. Premium costs 29 dollars a month, or 348 dollars a year, with Premium Plus at 588 dollars and Ultimate above it, and the screener carries hundreds of data points with portfolio analytics, dividend screening and fair value checks. A beginner who wants to screen precisely will find no stronger tool at this price.
What holds it back is the cost and the learning curve. At 29 dollars a month it costs more than TradingView Essential, and the full power of the screener needs weeks of learning, since the metric names alone can confuse a beginner. The interface looks dated next to Simply Wall St, and the research writing is thinner than Morningstar.
Stock Rover suits number driven beginners who want to screen precisely. It fits an investor building a dividend portfolio, a beginner who enjoys building screens, and anyone who wants portfolio analytics that show overlap and risk. The screener is the feature that matters, because a beginner who can build their own screen will stop depending on other people’s lists.
Build one screen with three filters, profitable, dividend above two percent, and price below fair value, then save it and rerun it weekly. If the saved screen becomes the first step of your week, Stock Rover will carry your research routine.
6. TipRanks
TipRanks is the analyst consensus tool in this guide, and its Smart Score is the reason. It gathers analyst ratings, price targets, insider trades and hedge fund activity into one page per stock, so a beginner can see what the professionals think without reading twenty separate reports. The Premium plan is reported at about 30 dollars a month, with annual billing bringing the monthly equivalent lower, so confirm the current figure on the vendor site before buying.
The drawback is the price for what a beginner gets and the consensus trap. About 30 dollars a month is a lot for a beginner with a small portfolio, and the consensus view reflects what is already known, so a stock that every analyst loves can still fall. The Smart Score blends many signals into one number, and a beginner who cannot see the inputs will not learn from it.
TipRanks suits beginners who want to check what analysts think before buying. It fits an investor who reads one analyst summary per stock, a beginner who wants insider and hedge fund signals in one place, and anyone who uses consensus as a check rather than a verdict. The consensus page is the feature that matters, because a beginner who sees twenty analysts disagree will think twice before buying on one opinion.
Open the consensus page for a stock you are considering, note the number of analysts and the spread of price targets, and compare it with your own reason for buying. If the spread makes you pause and reread the business, TipRanks will carry the checking step of your routine.
7. Simply Wall St
Simply Wall St is the most visual research tool in this guide, and its company snapshots are the reason. Every stock gets a snowflake diagram, a plain language summary of strengths and risks, and a fair value chart, so a beginner can grasp a company in five minutes without reading a spreadsheet. The Premium plan is reported at about 199 dollars a year, with a free tier covering limited views, so confirm the current figure on the vendor site before buying.
The drawback is the depth behind the visuals and the reported price. The snowflake is a summary, and a beginner who stops at the diagram will miss the numbers that produced it. The coverage is strongest on large companies, and the fair value model is a single method, so a stock can look cheap on one model and expensive on another. The price is reported rather than a fixed vendor list figure, since the site shows different offers by region.
Simply Wall St suits visual learners who want a fast company snapshot. It fits a beginner who learns from diagrams, an investor who wants a quick strengths and risks summary before reading deeper, and anyone who finds traditional research pages hard to read. The visual snapshot is the feature that matters, because a beginner who can see the whole company on one screen will actually finish the research.
Open the snapshot of a company you know well, read the strengths and risks, and check whether they match what you already know. If the snapshot reads true on a company you know, Simply Wall St will carry the first five minutes of every research session.
8. Yahoo Finance Premium
Yahoo Finance Premium is the quickest research upgrade for a beginner already using Yahoo Finance, and its familiarity is the reason. It costs 34.99 dollars a month, and it adds research reports, trade ideas, portfolio insights and advanced charting to the free Yahoo Finance pages most beginners already visit. A beginner who already checks prices on Yahoo Finance can add the Premium view without learning a new tool.
The drawback is the price and the breadth. At 34.99 dollars a month it costs more than TradingView Essential and Stock Rover Premium, and the research depth is thinner than Morningstar or Seeking Alpha. The trade ideas and portfolio tools are useful, but a beginner who wants deep analyst reports will find them lighter than the specialist tools.
Yahoo Finance Premium suits beginners who live on Yahoo Finance already. It fits an investor who checks prices daily, a beginner who wants portfolio insights without a new login, and anyone who prefers one familiar page to five specialist tools. The familiarity is the feature that matters, because a tool the beginner already opens will be used, and a tool that needs a new habit will be forgotten.
Turn on the Premium portfolio view, enter your holdings, and read the insights it shows about overlap and risk. If the insights change your next buy, Yahoo Finance Premium will carry your daily checking routine.
Building a Weekly Research Routine
A routine beats a binge. A beginner who researches for three hours on a Sunday and nothing for the rest of the week will forget half of what they read, while a beginner who spends twenty minutes a day, screening on Monday, reading one report on Wednesday and updating the watchlist on Friday, will build knowledge that compounds. The best ai stock analysis tools for beginner investors support that rhythm, because the screener, the report and the watchlist are the same three steps every week.
The routine needs a written record. A beginner who writes one sentence for each buy, stating the reason, the fair value range and the risk that would change the decision, will have a reviewable history within three months. A beginner who buys without writing anything will have only feelings to review, and feelings always rewrite the past in their own favour.

The Paper Trading Step Most Beginners Skip
Paper trading is the cheapest lesson in investing, and most beginners skip it because it feels slow. A beginner who paper trades a watchlist for four weeks, recording each imaginary buy and the reason behind it, will learn whether their screen actually picks winners or only picks stocks they like.
The step matters because real money changes behaviour. A beginner who loses paper money shrugs, while a beginner who loses real money panics, and the panic is what turns a small loss into a large one. Paper trading does not teach the feeling of a real loss, but it does teach the discipline of a written reason.
Frequently Asked Questions
How much should a beginner pay for stock research tools?
A beginner should pay between 15 and 30 dollars a month among the best ai stock analysis tools for beginner investors, or about 250 dollars a year for one deep service, and no more until the portfolio grows. TradingView Essential at 14.95 dollars a month is a sensible first paid tool, while Morningstar Investor at 249 dollars a year suits a beginner with at least 5,000 dollars invested.
Is Morningstar Investor worth it for a beginner?
Yes, when the beginner invests for the long term and reads the analyst reports. The fair value estimates and moat ratings teach a beginner how to judge a stock, which is a skill that lasts longer than any single pick. A beginner who wants daily ideas or fast trading signals will find the pace slow, and should pair Morningstar with a cheaper charting tool instead.
Can a beginner rely on AI stock ratings alone?
No, a rating is a filter, not a verdict. A quant rating or a Smart Score summarises numbers, but it cannot know whether a beginner needs income, growth or safety. A beginner should use the rating to narrow the field, then read one analyst report and one bearish view before buying, and write down the reason for the buy.
What is the cheapest good stock research tool for beginners?
TradingView Essential at 14.95 dollars a month is the cheapest good paid tool in this guide, and its free plan already covers basic charts. Yahoo Finance is free for price checking, and Morningstar Investor offers a seven day free trial. A beginner should test the free tier first, then pay only for the tool that becomes part of a weekly routine.
Do these tools give financial advice?
No, these tools publish research, ratings and data, and none of them is a licensed adviser to the reader. The tools cannot know a beginner’s income, debts, tax position or risk tolerance, so their output is information, not a recommendation. A beginner with a large sum to invest should speak to a qualified adviser before committing it.
How long before a beginner sees results from a research routine?
A research routine shows results in behaviour first and in returns much later. A beginner who follows a fixed weekly routine for three months will make fewer impulsive trades and will be able to explain every holding in one sentence. Portfolio returns take years to judge, and a beginner who judges a routine after one month will abandon it before it has a chance to work.
The Verdict on AI Stock Analysis for Beginners
Morningstar Investor takes the top spot because it teaches the beginner how to think, not only what to buy. The fair value estimates, the moat ratings and the analyst reports build a skill that survives any single stock, and the portfolio tools show the beginner what they actually own. The price is high for a small portfolio, but the lesson is the point, and a beginner who learns value first will make fewer expensive mistakes later.
Seeking Alpha Premium is the pick for daily researchers, TradingView is the pick for chart first learners, and Stock Rover is the pick for dividend screeners. The best ai stock analysis tools for beginner investors are not the ones with the most data, they are the ones that turn scattered minutes into a routine. Pick by learning style first, budget second, and run the one stock test on the top two choices. A beginner who does that will spend less time chasing tips and more time understanding the businesses they own.