

Two boutiques can buy the same dress from the same supplier and end the season in completely different places. One owner buys on instinct, orders the same number of every size, and discovers in week six that medium sold out while extra large sits untouched. The other owner checks last season’s sales by size, watches the sell-through rate every week, and reorders the sizes that actually move. If you want to use AI for boutique inventory planning, you are really choosing the second approach and giving it better maths. The tools do not replace taste. They replace guesswork about quantities, timing, and sizes, which is where most boutique money is quietly lost.
This guide is written for a small boutique owner, whether you sell from a shop, a website, or both. It covers seasonal buying, size curve planning, reorder triggers, dead stock handling, and real tool costs checked against vendor pages at draft time. You will finish with a weekly planning workflow and a reorder checklist you can run every Monday, plus a clear sense of which tool fits a boutique budget.
Why Boutique Buying Goes Wrong
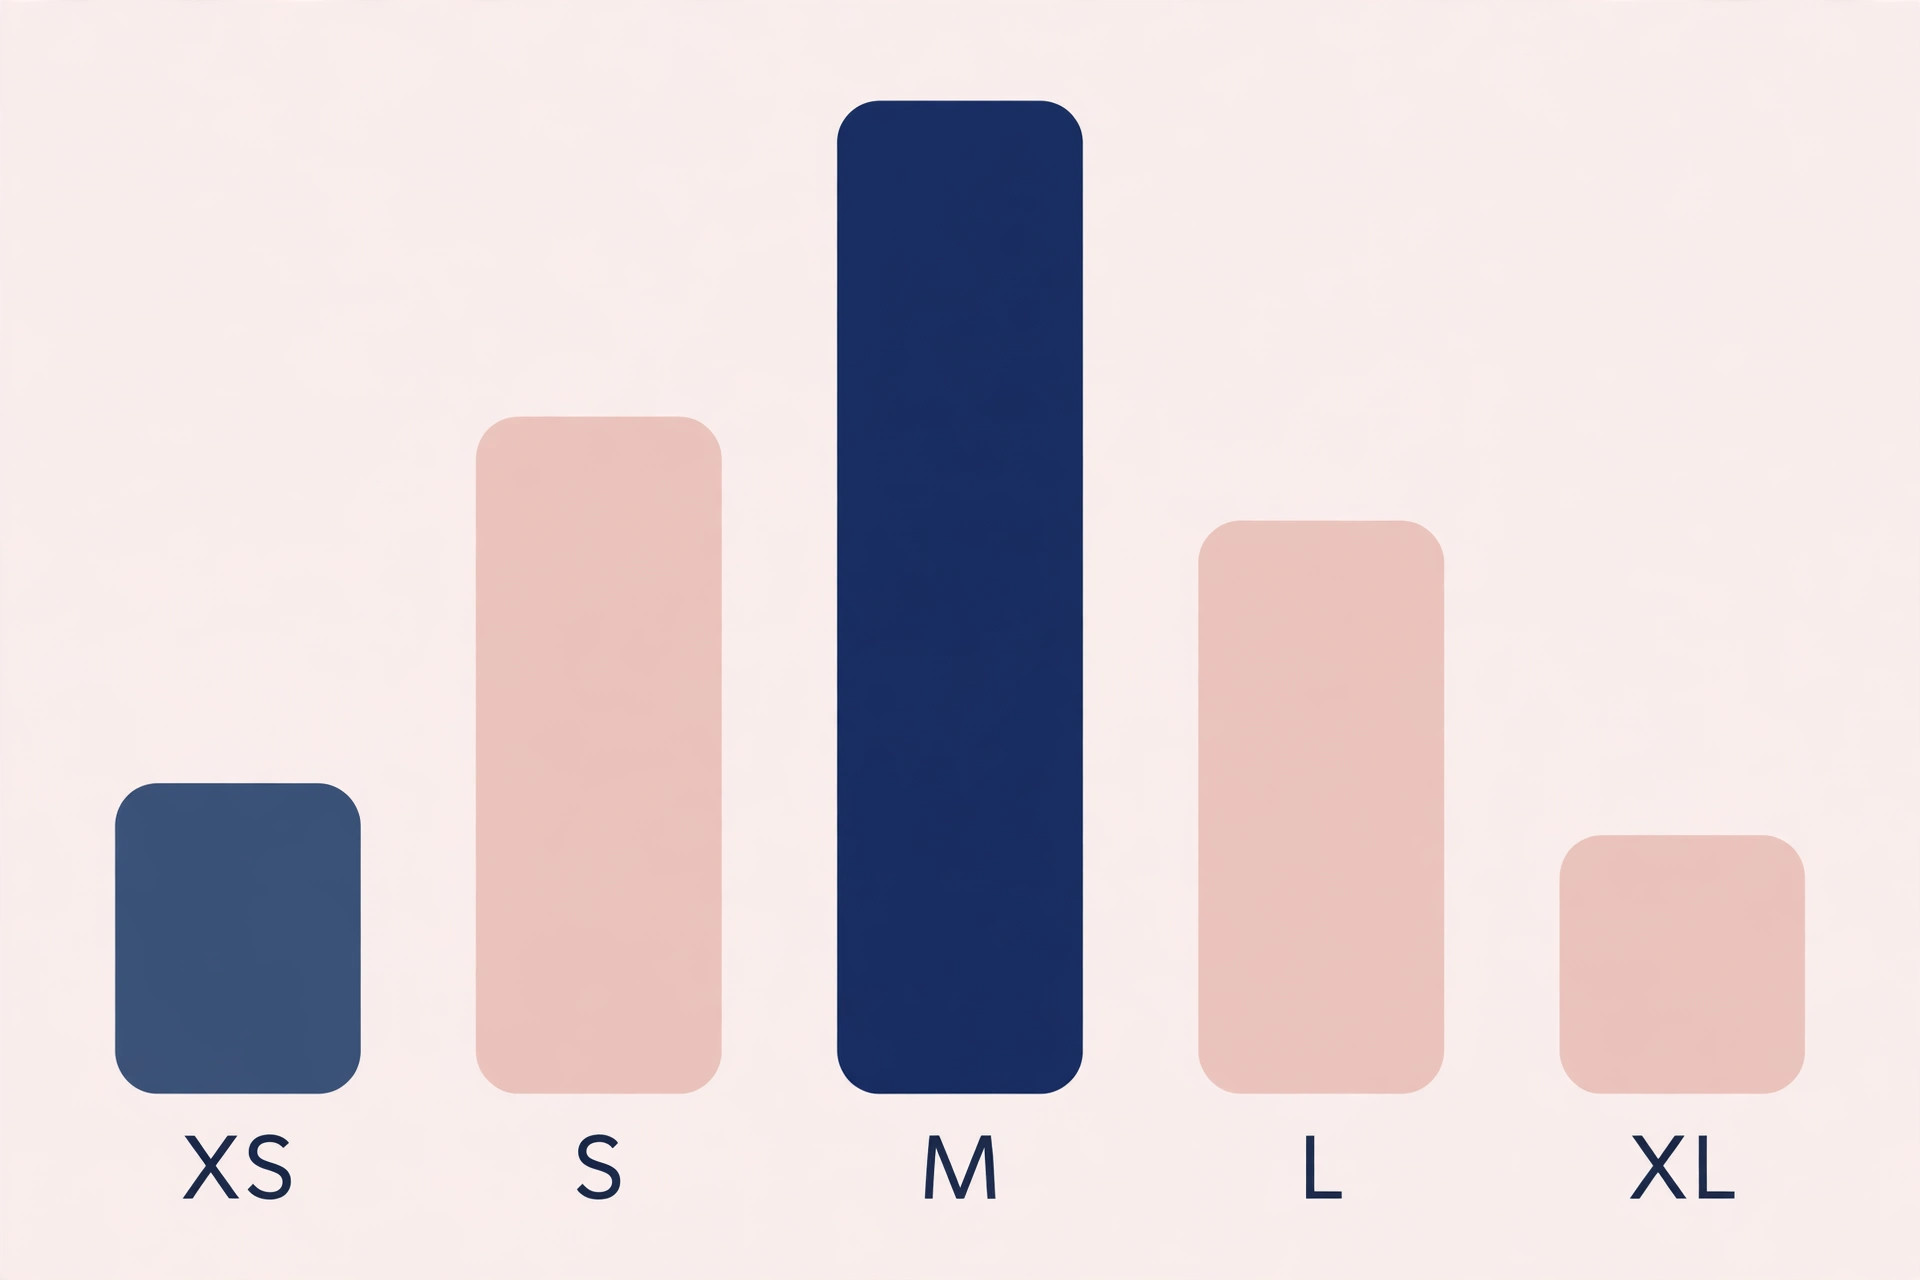
Boutique buying goes wrong in predictable ways, and none of them are about having bad taste. The first trap is buying the same quantity in every size. Suppliers often sell pre-packed size runs, and an even split feels fair. Customers do not buy evenly. Demand for most women’s styles forms a bell shape, heavy in the middle sizes and thin at the ends. A boutique that buys 12 of each size from extra small to extra large will run out of medium first, then large, while the ends pile up. The lost sales in the middle are invisible on a stock report that only shows total units left.
The second trap is buying for the season you wish you had, not the season your customers actually buy in. Spring stock ordered late arrives when customers have already bought their spring pieces elsewhere. Autumn coats bought too deep in one colour leave no budget for the second drop that would have carried November. Seasonal buying is a calendar problem before it is a taste problem, and the calendar has to be built backwards from when customers spend, not forwards from when a supplier catalogue lands.
The third trap is judging a style by total revenue instead of by sell-through. A dress that sold 60 units looks like a winner until you learn you bought 200 of them. Another dress that sold 40 of 50 units is the stronger performer, because 80 percent of the buy sold at full price while the first dress is heading for a markdown rail. Sell-through rate, calculated as units sold divided by units received and multiplied by 100, is the single most useful number in boutique buying.
The fourth trap is reordering from memory. An owner remembers that a style “sold well” but forgets that it sold well only in black, only in medium, and only after a price cut. A reorder based on that memory repeats the weak colours and sizes along with the strong ones. Good inventory planning separates what sold, in which size, in which colour, at which price, and in which week.
None of this means gut feel has no place. Taste picks the styles, the colours, and the story of a collection. Data decides how many of each to buy, when to reorder, and when to stop. A boutique that keeps taste in charge of selection and puts data in charge of quantities gets the best of both.

How to Use AI for Boutique Inventory Planning Without Losing the Human Eye
When vendors say AI in this context, they usually mean demand forecasting built from your own sales history. The tool looks at what sold, how fast it sold, and when, then projects what will sell next. Some tools add seasonality, so a style that peaks in December is not forecast as if December demand lasts all year. Others add size and colour level forecasts, so the projection is not just “200 units” but “200 units split this way across sizes”. A few add market basket analysis, which shows which items sell together, useful for planning complete outfits rather than isolated pieces.
What AI forecasting cannot do is invent demand for a style you have never sold, judge whether a new print will suit your customers, or know that a local event will change footfall next month. Treat a forecast as a starting number, then adjust it for things only you know. A new supplier with a longer lead time, a price rise, or a shop refit that closes you for a week all change the number. The strongest workflow is forecast first, human adjustment second, and a written note about why you adjusted. That note stops next season’s buyer, who may be you, from repeating a mistake nobody recorded.
Data quality decides everything. A forecast built on dirty data will confidently recommend the wrong buy. Before you trust any tool, check three things. First, are your sales recorded by variant, meaning size and colour separately, not just by style? Second, are returns recorded against the right variant, so a size that came back is not counted as a sale? Third, do you have at least one full season of history, or a clear plan for new styles with no history? If your records are thin, clean one season of data in a spreadsheet before paying for forecasting software. The tool will still be there next month, and it will work far better on clean inputs.
A practical test for any tool is to ask it to forecast a season you already lived through, using only data from before that season. If its forecast for a known style is wildly off, ask why before you trust it on an unknown one. Good tools explain their reasoning in plain terms, such as current daily sales rate, days of stock left, and supplier lead time. Tools that hide behind a single score with no explanation are harder to argue with, and you need to be able to argue with a forecast when your knowledge of the shop says it is wrong.
Build Your Seasonal Buying Calendar
Seasonal buying works when the calendar is built backwards. Start from the week customers actually want the product, subtract the supplier lead time, subtract a buffer for delays, and that gives you the latest order date. A spring collection customers buy in March, from a supplier needing six weeks, must be ordered by mid January at the latest, not when the catalogue arrives in February. Even boutiques that use AI for boutique inventory planning still need this calendar, because a forecast cannot set your order dates for you. Build the calendar once a year, then review it every quarter, because lead times change and suppliers go quiet at holidays.
A workable boutique year has four buying moments, not one giant annual order. The main seasonal buy sets the core range. A mid-season top-up reorders proven winners in the sizes that sold out. A transitional buy bridges seasons, such as lightweight layers between summer and autumn. A clearance and learning review closes the season and records what the next buy should change. Spreading buying across four moments lowers risk, because each later decision uses real sales data from the season already in progress.
Depth and breadth need a deliberate balance. Breadth means how many different styles you carry. Depth means how many units of each style. New boutiques usually need more breadth and less depth, because they are still learning what their customers want. A wide range in shallow depth, with fast reorders on winners, teaches you faster than a deep buy in a few styles that might miss. Cap any unproven style at a small test quantity, and only go deep after it proves itself at full price.
Open to buy is the budget discipline that holds the calendar together. Open to buy is the money you have left to spend after accounting for stock already on order and stock already on the shelves. Many boutiques overspend early in a season because they buy the full range at once, then have nothing left to reorder the winners. Keep a reserve, commonly 20 to 30 percent of the seasonal budget, for mid-season reorders and opportunities. That reserve is what turns a sold-out winner into more sales instead of a missed season.

Size Curve Planning, Step by Step
A size curve is the percentage of demand each size represents for a style or a category. If medium accounts for 30 percent of sales, then 30 percent of your buy should be medium. The calculation is simple, but the traps are in the details, so work through it methodically.
- Pull sales by size for one style family over the last two seasons. Group similar styles together, such as fitted dresses or relaxed knitwear, because a fitted style and a relaxed style rarely share a curve. Relaxed fits often sell across fewer sizes, because customers happily sit between sizes.
- Express each size as a percentage of total units sold in that family. If you sold 350 units and 105 were medium, medium is 30 percent. Do this for every size, and check that the percentages add to 100.
- Compare what you sold against what you bought. If you bought 20 percent in extra large but only 8 percent of sales were extra large, you overbought that size. The gap between bought and sold, size by size, is where dead stock is born.
- Adjust for stockouts before you trust the curve. A size that sold out in week three did not stop selling because customers lost interest. It stopped selling because there was nothing left to sell. If medium sold out early, its true share of demand is higher than its share of recorded sales. Note stockout weeks and adjust the curve upward for sizes that ran out first.
- Separate markdown sales from full price sales. A size that only moved at 50 percent off is not a size to buy deep next time. Build the curve from full price sales first, then check whether markdowns changed the picture.
- Turn percentages into units for the new buy. A 240 unit buy with a curve of 8 percent extra small, 22 percent small, 30 percent medium, 26 percent large, and 14 percent extra large becomes roughly 19, 53, 72, 62, and 34 units. Round sensibly, give the rounding remainder to the best selling size, and never round a size down to zero unless you have deliberately decided not to carry it.
- Write the curve on the purchase order itself, not in a separate notebook. A purchase order that says “240 units, assorted” invites the supplier to send an even split. A purchase order that lists units per size protects the plan.
When you have no history, start from a sensible bell shape and treat it as a hypothesis, not a fact. Published boutique guidance and factory reorder patterns often land near 8 percent extra small, 20 percent small, 30 percent medium, 25 percent large, 12 percent extra large, and 5 percent double extra large for women’s loungewear and similar categories. Your customers may differ, especially if you serve a younger audience that skews smaller or a plus size audience that skews larger. Use a starting curve for the first buy only, keep the buy shallow, and rebuild the curve from your own sales as soon as you have them.

Reorder Triggers That Replace Panic Buying
A reorder trigger is a rule that tells you when to order, before a stockout forces a rushed decision. The simplest trigger is a reorder point, calculated from daily sales rate multiplied by supplier lead time in days, plus safety stock. If a style sells two units a day, your supplier takes 14 days, and you want seven days of safety stock, the reorder point is 42 units. When stock falls to 42, you order. The maths is not glamorous, but it replaces the weekly feeling of “we might be running low” with a number you can check in minutes.
Safety stock deserves its own decision, because it is insurance, not waste. Fast selling core styles in your best sizes deserve more safety stock than experimental styles. A core black dress in medium that sells steadily all year should rarely stock out, so hold a deeper buffer. A trend colour in an extreme size can run lean, because a stockout there costs little and a leftover costs a markdown. Set safety stock by style importance, not by a single blanket rule, and review it when lead times change.
Lead time is the part most boutiques underestimate. It is not just production time. It includes order processing, shipping, and receiving in your shop. Ask suppliers for a realistic total, add a buffer week for busy periods, and record the actual lead time when the order arrives. If a supplier quotes 14 days but delivers in 24, your reorder points are wrong for every style they supply.
Not every style deserves a reorder. Reorder the styles that meet three tests. First, sell-through at full price is healthy, roughly 70 percent or better with meaningful time left in the season, or the style is a proven core line that sells year round. Second, the remaining sizes match demand, meaning the sizes you would reorder are the ones customers actually want. Third, the margin after delivery cost still works, because a reorder that only sells after a discount may be worse than letting the style end. A style that fails two of these tests is a candidate for clearance, not for a reorder.
The Weekly Planning Workflow
This workflow is how you use AI for boutique inventory planning, and it is the overview-proof core of this guide. It is a repeatable Monday routine that turns sales data into buying decisions in under two hours for a small boutique. Run it weekly during a season, and fortnightly in quiet periods. The discipline is in doing it on schedule, not in doing it perfectly.
- Update stock and sales data. Record the week’s sales by style, size, and colour, plus returns. If you record manually, this step takes longest, and it is the step worth automating first.
- Review sell-through by style. Flag any style above 70 percent sell-through with weeks left in the season as a reorder candidate. Flag any style below 40 percent as a clearance or investigation candidate. Note which sizes and colours drive each result.
- Check size level stockouts. List every size that sold out or will sell out before the next delivery could arrive. A style can look healthy overall while its best sizes are already gone, and that is lost revenue hiding inside a good headline number.
- Run the forecast. Project the next four weeks of demand for flagged styles, adjust for known events such as a local market or a planned promotion, and write down each adjustment and why.
- Apply the reorder triggers. For each candidate, calculate the reorder point from daily sales rate, lead time, and safety stock. Order only the sizes and colours that pass the three reorder tests above. Skip the rest deliberately, and note the skip.
- Place or schedule the orders. Send purchase orders with units per size, confirm delivery dates in writing, and record expected arrival dates.
- Plan dead stock actions. For styles flagged for clearance, decide this week whether to markdown, bundle, move to a different channel, or return to the supplier where terms allow. Dead stock decisions delayed by a month are markdown decisions made under worse conditions.
- Update the open to buy. Subtract new orders from the seasonal budget, check the reserve for later reorders, and confirm you have not spent the money you need for the next proven winner.
- Record one lesson. Write a single sentence about what this week taught you, such as a size that sold out twice or a colour that only moved on discount. These sentences become next season’s buying notes, and they are the cheapest market research a boutique can own.

The Reorder Checklist
Use this checklist every time you are about to reorder a style, whether the suggestion came from a tool or from your own notes. If a style fails more than two items, pause the reorder and investigate before spending.
- Sell-through at full price is at least 60 percent, or the style is a proven year round core line with steady weekly sales.
- The sizes you plan to reorder are the sizes customers are actually buying, not just the sizes still in stock.
- Daily sales rate is calculated from the last four weeks, excluding any week distorted by a one-off event or a deep discount.
- Supplier lead time is confirmed in writing, including delivery and receiving time, not just production time.
- Reorder quantity covers lead time demand plus safety stock, and no more, so the reorder itself does not become next season’s dead stock.
- Margin still works after delivery cost, payment fees, and any expected markdown on slow sizes.
- Open to buy covers the order while keeping a reserve for the next proven winner.
- The purchase order lists units per size and per colour, matching the size curve, not an even split.
- Expected arrival date is recorded, and a follow-up date is set if the order has not arrived by then.
- The reason for the reorder is written down in one line, so next season’s review can tell a good reorder from a lucky one.
Print this list or keep it beside the ordering screen. A checklist feels slow the first three times you use it, then it feels fast, because it stops the two most expensive mistakes in boutique buying, which are reordering a dying style and reordering the wrong sizes of a living one.

Dead Stock. Clear It Without Training Customers to Wait for Sales
Dead stock is stock that has stopped selling at full price and is tying up money and shelf space. Every boutique gets some. The goal is not zero dead stock, which would mean you never took a risk on a new style. The goal is to notice it early, clear it, and learn from it. A style at under 40 percent sell-through with a few weeks of season left needs a decision, not another month of hope. Even when you use AI for boutique inventory planning, some dead stock is inevitable, so the clearance habit matters as much as the forecast.
Start with diagnosis before discounting. Check whether the problem is the style, the size mix, the colour, the price, or the placement. A dress that sells in black but not in mustard has a colour problem, and discounting the whole style punishes the colour that works. A style that sells online but not in the shop may have a display problem. Fix the cause where you can, such as moving the piece to a better rail or photographing it styled differently.
When a discount is the right move, make it decisive and time limited. A small, endless 10 percent reduction trains customers to wait and still leaves stock behind. A clear end of season event, a bundle with a strong seller, or a move to a different channel, such as an outlet rail or an online clearance section, often clears faster and protects the full price reputation of your main range. Set a deadline for each clearance action, and if the stock is still there after it, move to the next action rather than repeating the same discount.
Tool Costs, Checked Against Vendor Pages
Tool prices below were checked against vendor pages and reputable vendor roundups at draft time. Prices change, and several tools price by order volume or plan tier, so confirm the price on the vendor page before you pay. If you use AI for boutique inventory planning, the fee only makes sense when the tool saves you more in avoided stockouts and markdowns than it costs each month.
| Tool | What it does for a boutique | Starting price at draft time |
|---|---|---|
| Shopify built-in inventory | Stock tracking, purchase orders, transfers and counts inside Shopify admin | Included with Shopify plans, from 39 dollars a month on Basic |
| Prediko | AI demand forecasting, purchase orders and replenishment for Shopify stores | From 49 dollars a month |
| Stockful | Forecasting and purchase order replacement for former Stocky users | From 39 dollars a month |
| Monocle | AI demand forecasting, market basket analysis and ABC-XYZ analysis on Shopify | From 47 dollars a month on Starter |
| Sensible Inventory Forecasting | Straightforward forecasting with supplier handling and weekly emails | 29 dollars a month |
| Logistified | Stockout forecasting, season aware models, supplier rules and barcode receiving | 12, 29 or 59 dollars a month by tier |
| Bucey | AI demand planning, purchase order workflows and omnichannel sync | 20 dollars a month early bird, plus usage charges capped at 500 dollars a month |
| Inventory Planner | Forecasting and replenishment for larger Shopify catalogues | From 249.99 dollars a month |
| Cin7 | Full inventory and order management across channels | From 349 dollars a month |
A note on Stocky is important, because older guides still recommend it. Shopify’s Stocky app was discontinued on 31 August 2026, so do not build a new setup around it. If you used Stocky, Stockful and Prediko are the replacements most often cited in 2026 roundups. For a boutique on a tight budget, the sensible path is to start with Shopify’s built-in tools plus a spreadsheet for size curves, then add a forecasting app only when manual planning takes more than a few hours a week or when stockouts keep recurring.
Match the tool to your stage, not to the longest feature list. A boutique with under 200 active styles, one location, and steady suppliers will get most of the benefit from clean variant level data, a weekly workflow, and a reorder checklist. A forecasting app earns its fee when your catalogue grows, when you sell across channels, or when manual forecasts start taking a whole day.

If this guide has convinced you to tighten up the numbers side of the shop, the next step is to look at how inventory planning connects to the rest of the business. A good starting point is the guide to automate small business with AI, which shows where automation saves real time and where a human still needs to decide. For the money side, the roundup of best accounting software for small business helps you keep stock value, margins, and cash flow in one honest picture.
If you sell through a marketplace as well, the comparison of Shopify versus Etsy and the guide to best AI tools for Etsy sellers are useful companions, because channel choice changes how stockouts and size curves behave.
Frequently Asked Questions
How do I use AI for boutique inventory planning when I have no sales history?
Start with a manual plan, not a forecasting subscription. Use a sensible starting size curve, keep the first buy shallow, and collect size level sales from day one. A pre-order or waitlist that asks for size gives you early demand signals before you commit to depth. After one season, you will have the history a forecasting tool needs, and the tool will be far more useful than it would have been on guesswork.
What is a good sell-through rate for a boutique style?
For fashion styles, 70 to 80 percent sell-through at full price by end of season is a healthy result in most apparel guidance. A style at 90 percent well before season end was probably under-bought and deserves a reorder if the sizes left match demand. A style at 40 percent with weeks left needs investigation, and a style under 25 percent mid-season needs a decision, not patience.
How often should I review inventory and place reorders?
Weekly during a season, fortnightly in quiet periods. A weekly rhythm catches size stockouts before they cost a full week of sales, and it stops reorders from becoming panic decisions. The review itself should take under two hours for a small boutique once the workflow is routine.
What does it cost to use AI for boutique inventory planning?
Costs range from free to several hundred dollars a month. Shopify’s built-in inventory tools come with Shopify plans from 39 dollars a month on Basic. Sensible Inventory Forecasting costs 29 dollars a month, Stockful starts at 39 dollars a month, Monocle starts at 47 dollars a month, and Prediko starts at 49 dollars a month. Larger tools such as Inventory Planner from 249.99 dollars a month and Cin7 from 349 dollars a month suit bigger catalogues, not a small boutique.
Should I trust a forecast that disagrees with my experience?
Trust it enough to investigate, not enough to obey blindly. Check the inputs first, especially lead time, size level history, and whether a stockout distorted the data. If the inputs are clean and the tool explains its reasoning, such as daily sales rate and days of stock left, take the disagreement seriously. If the inputs are dirty or the tool cannot explain itself, trust your experience and fix the data before the next forecast.
How do I handle a style that only sells in one size or colour?
Do not reorder the full range. Reorder the sizes and colours that sell, in the quantities the size curve supports, and clear the rest deliberately through bundling, a different channel, or a time limited clearance event. Then record the lesson. Repeating a full range order for a style with a narrow demand profile is how dead stock accumulates season after season.
Buy Less, Sell More of What Moves
The boutiques that do well on inventory are rarely the ones with the most stock. They are the ones whose stock matches their customers, size by size and week by week. Taste brings customers in. Quantities, timing, and size curves turn that interest into full price sales instead of markdown rails and empty medium rails. The tools in this guide help with the second half, but the discipline matters more than the software.
If you take one habit from this guide, make it the Monday workflow. Two hours, once a week, working through sell-through, stockouts, forecasts, triggers, orders, dead stock, open to buy, and one lesson. Run it for a full season and you will know your customers better than any trend report can tell you. And when you do decide to use AI for boutique inventory planning in a bigger way, with a forecasting tool on real data, you will already have the judgement to tell a good recommendation from a confident mistake. That judgement, plus the numbers, is what keeps a boutique profitable when the season turns.